

The C3S Edu Demo: Discover how it supports teachers in teaching GIS and climate change issues
The Copernicus Climate Change Service (C3S) Climate & Energy Education Demonstrator (C3S Edu Demo) is an interactive tool to help address climate change through education. Together with the school curriculum, it gives students a chance to explore how the European climate has changed and is projected to in the future. The C3S Edu Demo allows non-technical users to explore scientific climate and energy data in a visual way across an interactive map of Europe. It uses robust historical data ranging from 1979 up to 2016 (soon to be updated and extended) and offers projected data up to 2100 for comparison.
Resources to support for teaching with the C3S Edu Demo
Many teachers will recognise the C3S Edu Demo as a Geographical Information Systems (GIS) tool. A range of syllabuses on a national scale such as the UK’s AQA GCSE Geography course through to the international, like the Geography International Baccalaureate requires students to learn data interpretation and analysis skills through GIS. Additionally, the issue of climate change is increasingly becoming a cross-curricular topic of study, no longer exclusive to traditional subjects like Geography or Science. The C3S Edu Demo provides teachers and students the ability to use a GIS, fed by robust scientific data to support the learning of climate change and energy issues.
Although a lot can be learned by simply exploring the C3S Edu Demo itself, a number of supplementary educational resources have been developed to support teachers engage their students. Accessible via the Edu Demo’s ‘Resources’ link (via the hamburger menu at top right), or directly via the Edu Demo’s project page ‘Resources’ tab, teachers and students can find variable factsheets, videos, and downloadable worksheets.
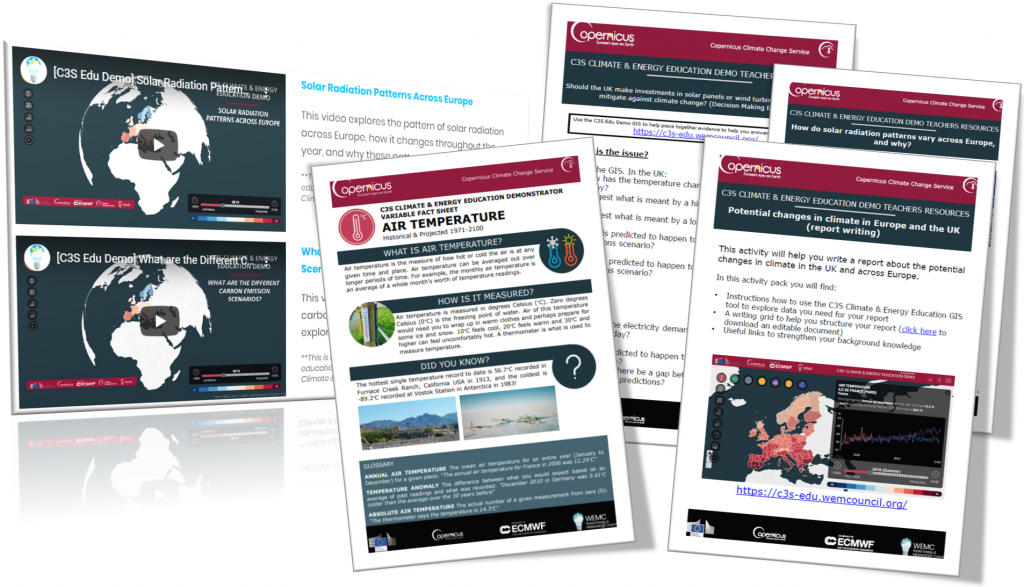
The variable factsheets can also be accessed with a single click on the C3S Edu Demo, using a button top-right next to the hamburger menu. These factsheets give users the opportunity to understand what each variable means in student-friendly language. Each includes a non-technical definition or the variable, a ‘Did You Know?’ providing facts to add an element of fun, a relevant ‘mini’ case study to provide real-life context, and a ‘critical thinking’ element to encourage data literacy. There are two educational videos available which combine messages that can be learned from the C3S Edu Demo and demonstrate how it works. See how the C3S Edu Demo can show you how and why solar radiation patterns vary across Europe, and the different carbon emission scenarios and what they mean for future temperature changes. And four worksheets written by teachers are available to download. Students can perform a decision-making exercise to explore the background and context for the suitability of and need for renewable energy in the UK, write a report which builds on background knowledge to the issue of climate change and helps them to practice describing changes based on data, complete a guided quiz to help them describe and explain the pattern of solar radiation across Europe and between seasons, and explore how the range of a selected European tree species may adapt due to climate change.
Teachers who create their own resources using the C3S Edu Demo are very welcome to send them to the WEMC team, and they will be edited and shared via the ‘Resources’ page with credit to the author.
Exciting developments to come
Guided by feedback from users, work continues on improving and enhancing the C3S Edu Demo. The use of a global dataset for users to explore changes outside of Europe, and the compatibility for mobiles are just two examples. Watch this space!
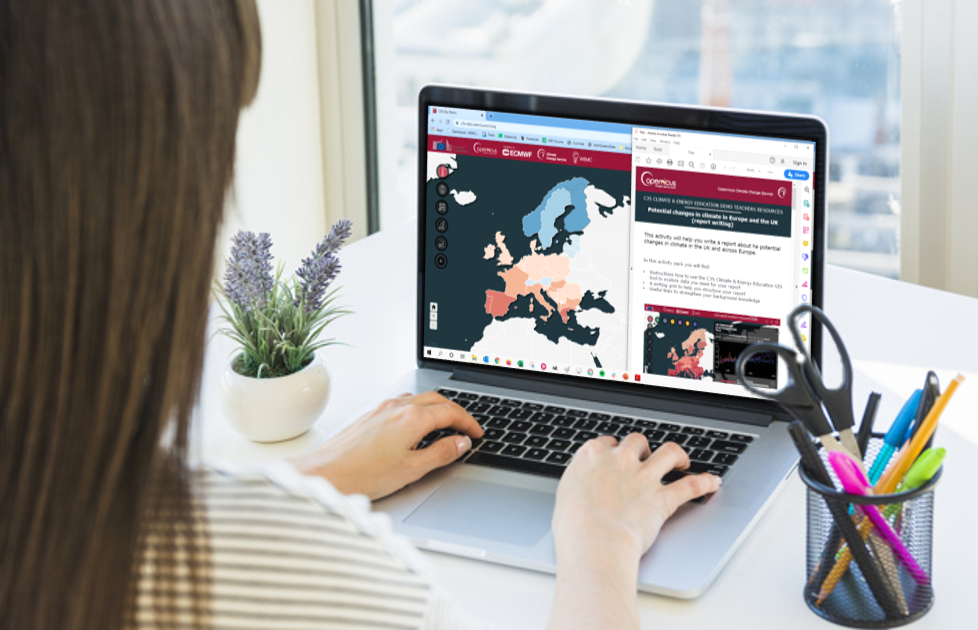
Access the C3S Edu Demo via https://c3s-edu.wemcouncil.org and visit the project’s webpage to find a range of support material, including educational resources produced by teachers.


