Tech Blog: The upcoming rainy season for 2023: When will the rains begin in South-East Africa?
FOCUS-Africa is a H2020 EU funded project which is developing tailored climate services in the Southern African Development Community (SADC) region. The World Energy and Meteorology Council (WEMC) is a contributing partner across various case studies and work packages.
Building upon our recent work on the understanding of southeast African Monsoon variability and its predictability (Zampieri et al. 2023, Roy at al. 2023), we have now looked deeper into the prediction of the onset of rainy seasons, particularly for Tanzania, Malawi and Mozambique, but also Rwanda, Burundi and Zimbabwe. Here we present the prediction produced in September for the upcoming 2023 rainy season, which usually starts between October and December, having monitored the forecast behaviour over the past few months. As the forecast signal has been showing a high consistency, and has become stronger with the latest September forecast, we are publishing this blog, which also acts as an advisory bulletin for anyone whose activities in the region depend on rainfall.
Before delving into the actual forecast, we discuss a little about our (seasonal) forecast approach, to demonstrate the robustness of the methodology used. In brief, the forecast is produced by means of a machine learning model which uses a combination of observational data and dynamical seasonal forecast model output. We utilize the well-known Random Forest method, which is based on the creation of multiple decision trees during a training phase. When used in prediction mode, each tree produces a prediction based on the relationship between predictors in its branches derived during the training, and the average of all the individual trees is then used as the final prediction. Imagine asking a panel of experts for an answer each, and using the average of all their answers as the final result. It is an effective method that can handle large datasets and give accurate predictions, especially with complex climate data.
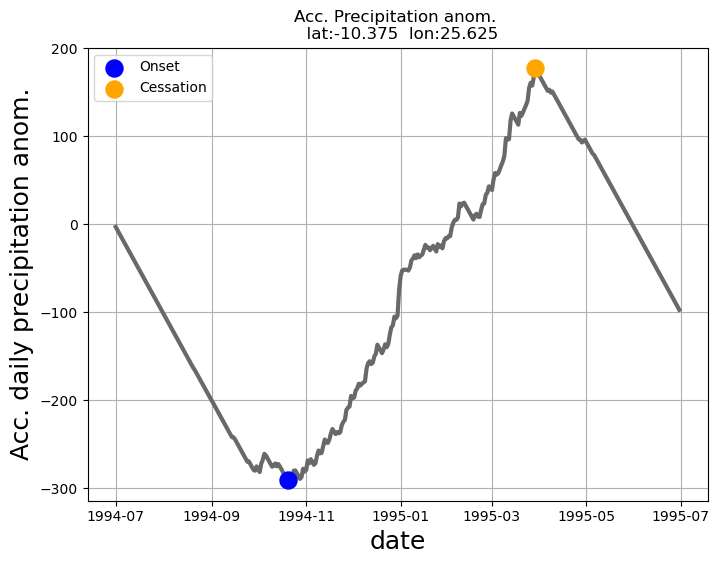
The first step was to create a historical gridded dataset for the region of the October-November-December (OND) rainy season onset dates. We did this, computing daily accumulated precipitation anomalies, using the Multi-Source Weighted-Ensemble Precipitation (MSWEP) historical precipitation data. By subtracting the long-term average rainfall from daily values, daily anomalies are derived. These anomalies are then cumulatively summed over a period, producing a curve that fluctuates around zero. The onset of the rainy season for each year is found when this curve reaches its minimum and begins a sharp upward trend, indicating a consistent period of above-average rainfall (see Figure 1, based on Zampieri et al. 2023). This approach provides an objective, data-driven means to capture the variability at the start of the rainy season, making it a reliable method especially in regions such as the one considered here, where onset timing varies year-to-year.

Figure 1. Example to show how the methodology for identifying the onset (and the cessation) of the rainy season using the accumulated daily anomalies is represented for a location within our study area.
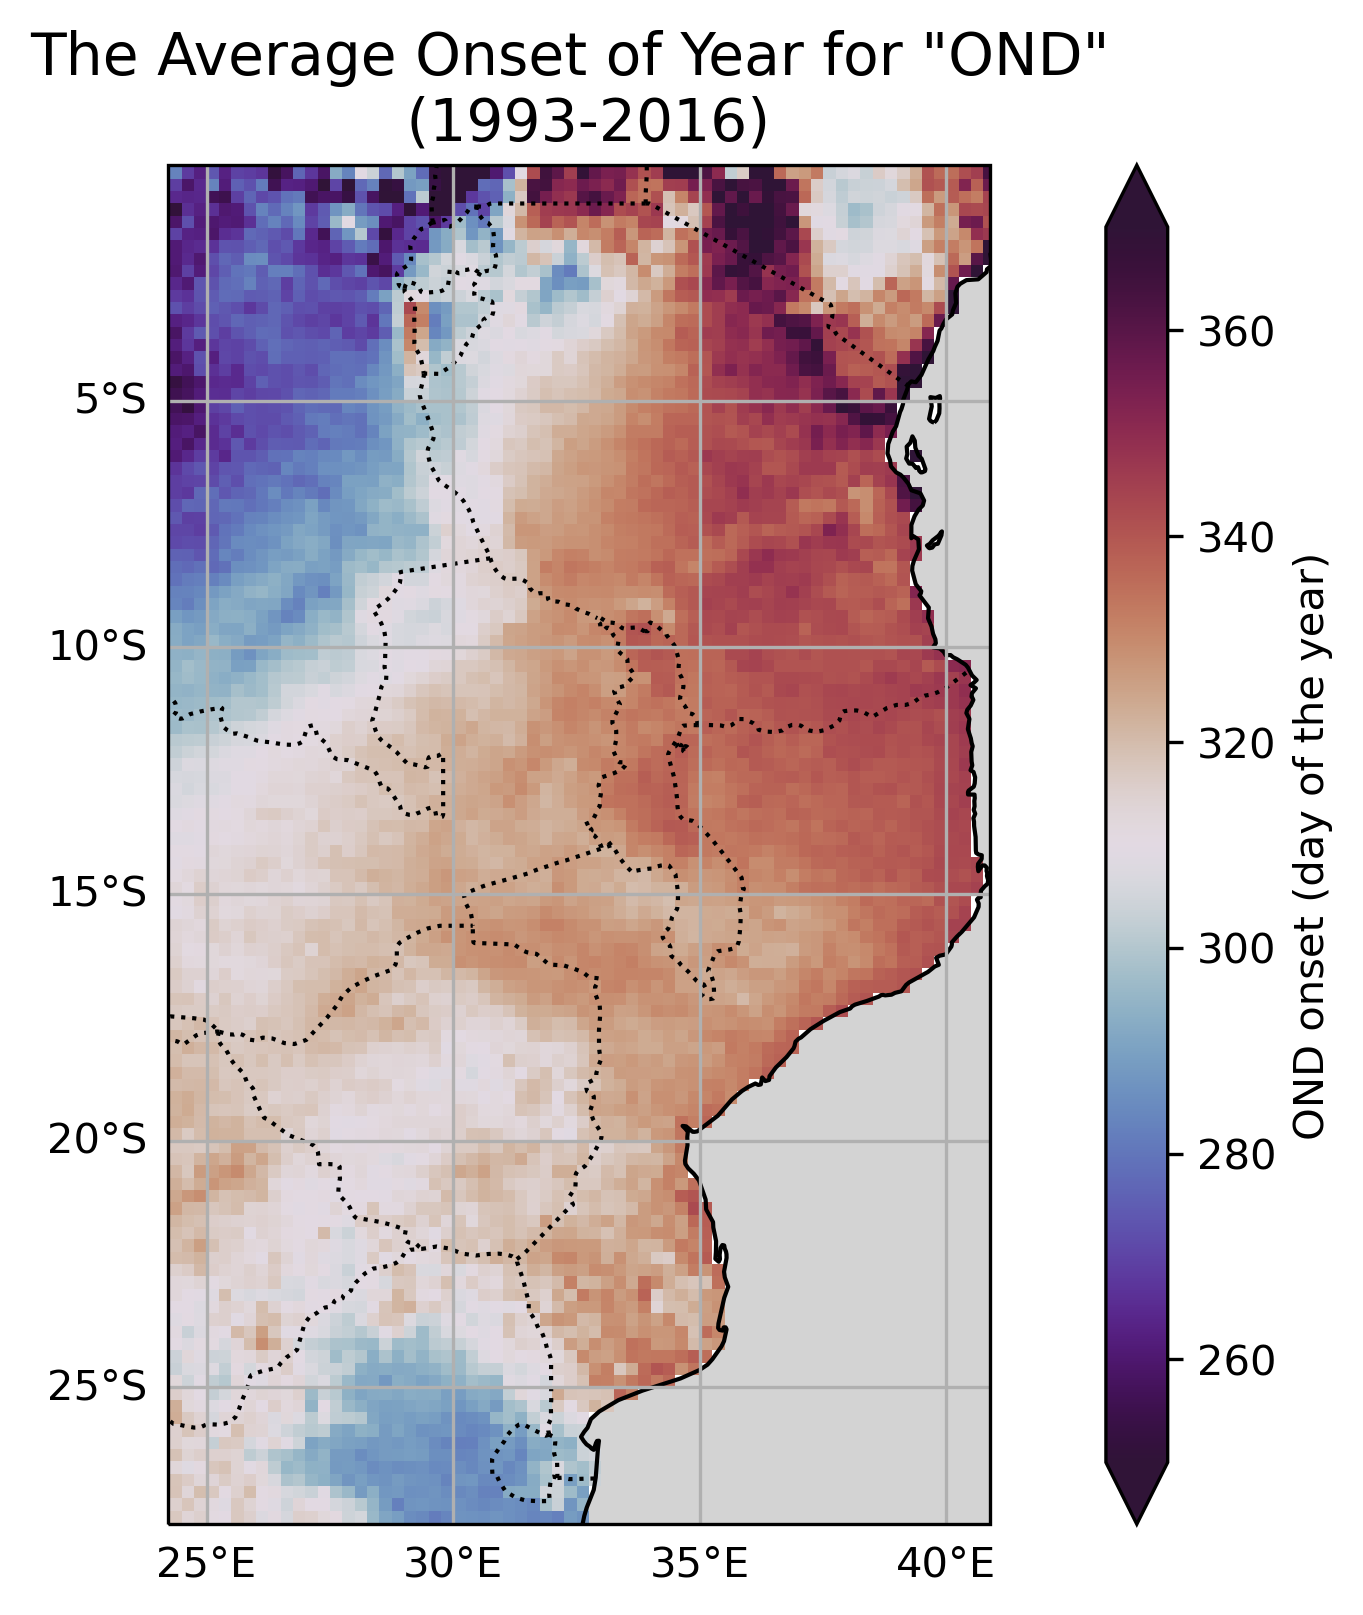
We computed the OND rainy season onset for the years from 1993 to 2016 to create the historical gridded dataset to be used as reference for the training of the Random Forest model (Figure 2). This shows that, on average, the earliest onset computed with this technique can be seen in the areas of the Democratic Republic of Congo, Rwanda and Burundi together with the most North-western part of Tanzania, Eswatini and some parts of North-eastern South Africa. The ‘delayed’ average onsets are seen over Mozambique, Malawi and in particularly North-eastern Tanzania across the border with Kenya.

Figure 2. The mean (1993-2016) OND onset computed with the accumulated daily anomalies method (see Figure 1) using the MSWEP precipitation dataset.
Our model uses a comprehensive list of predictors to forecast the onset of the rainy season in the south-eastern African region. These predictors are:
- Observations of: i) the ENSO3.4. a measure of the El Niño-Southern Oscillation strength, measured by an average sea surface temperature (SST) in the middle of the Pacific Ocean; ii) the IOD (Indian Ocean Dipole) SST index with lag 1 to 3 months; iii) the observed precipitation also with lag 1-3 month.
- Dynamical seasonal forecasts model output for: i) ENSO3.4 and IOD with lead time 1-3 months, calculated from forecast SST anomalies; ii) forecasts of the onset date for each forecast ensemble member, using the same accumulated daily anomalies method as for the historical observed onsets mentioned above. For each dynamical model, the onset prediction is taken as the mean of the ensemble members. The systems included are:
| Model | Institution | Version | Ens. Members |
|---|---|---|---|
| CMCC | Centro Euro-Mediterraneo sui Cambiamenti Climatici (Euro-Mediterranean Center on Climate Change) | 3.5 | 40 |
| DWD | Deutscher Wetterdienst (German Weather Service) | 2.1 | 30 |
| ECCC* | Environment and Climate Change Canada | 3 | 20 |
| ECMWF | European Centre for Medium-Range Weather Forecasts | 5.0 | 25 |
* The ECCC consists of the two individual systems: CanCM4i and GEM5-NEMO with 10 members each.

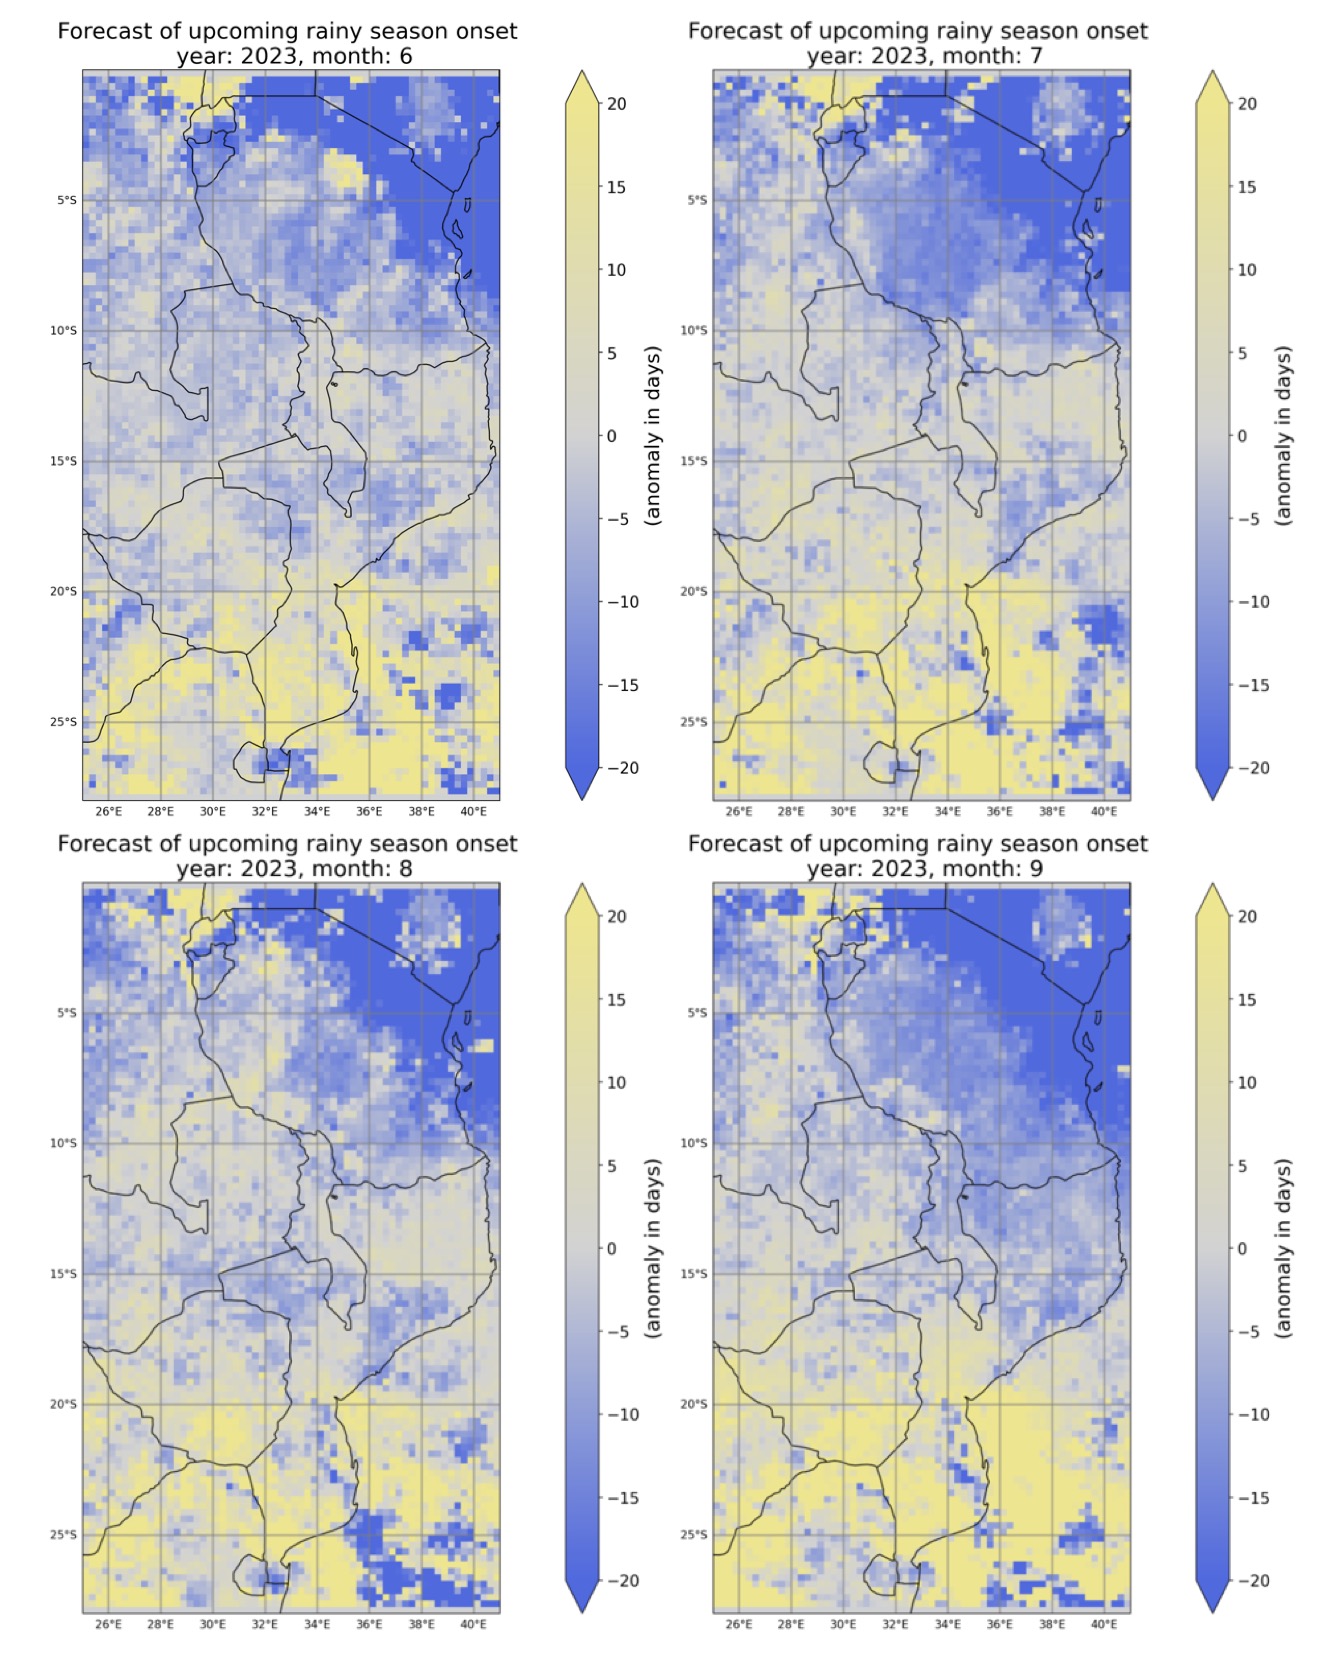
Figure 3. Forecasts of the anomaly of the onset dates for the upcoming October-December 2023 rainy season for four forecast start dates: June (top left) and July (top right), August (bottom left), September (bottom right). Regions in blue indicate early onset, while regions in yellow predict later than onset times found in the observations.
Based on the forecasts, especially the latest one produced in September (Figure 3, bottom right), some noteworthy highlights about the onset of the 2023 rainy season across various parts of southeast Africa can be summarised as follows:
- An early onset of the rainy season is anticipated for Malawi, North-eastern Mozambique, and Tanzania.
- Zimbabwe and southern Mozambique can in general expect either a late or normal onset of the rainy season.
It is worth noting that these are typical patterns one would expect in an El Niño year (e.g. Roy et al. 2023), as 2023 is forecast to be.
In terms of most important drivers of the prediction, we have found that a mix of observations of both large-scale drivers like ENSO 3.4 and the IOD and observations of local precipitation from the previous months together with dynamical seasonal forecast predictions of the onset of the upcoming rainy season is needed to maximize the skill of the prediction.
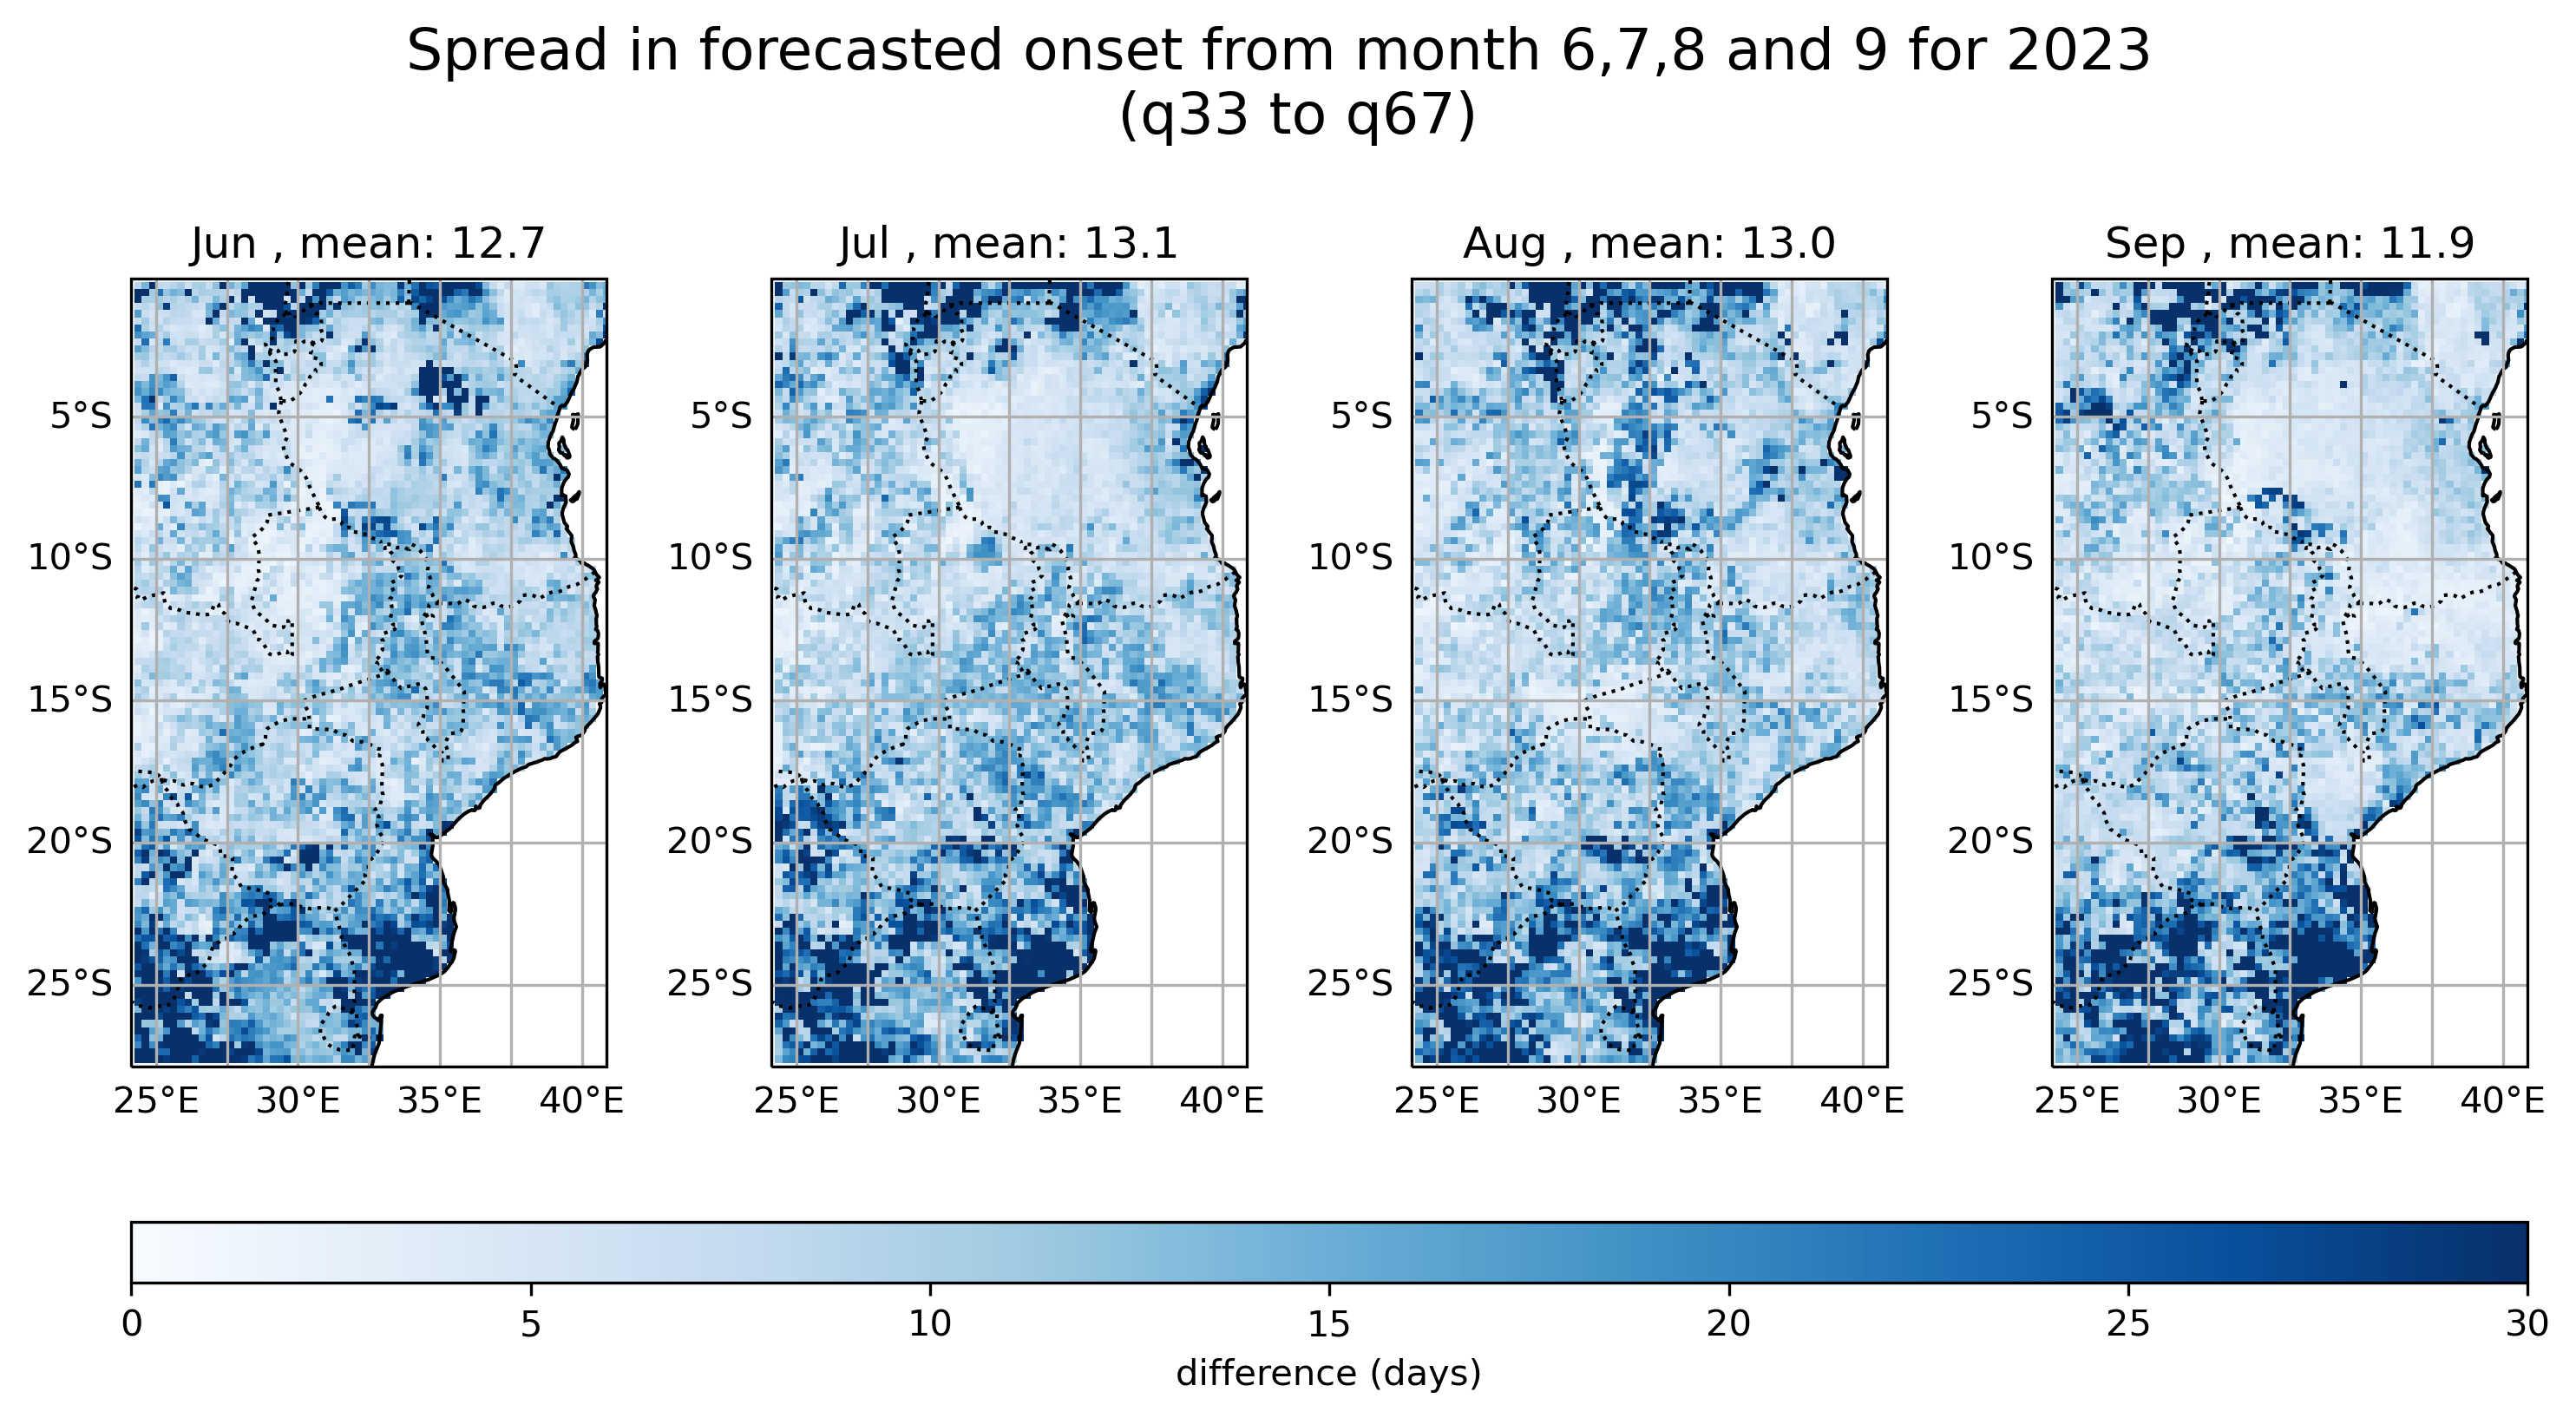
One of the advantages of the RF model is that it provides an ensemble of forecasts, which can be used to form a distribution. Thus, instead of solely relying on the mean of the distribution (as shown in Figure 3), we can extract more information from the forecasts. We do this by analysing its spread to understand forecast uncertainty. From the forecast distribution, we derive quantile-based measures like the q33 and q67, representing the 33rd and 67th percentiles. This approach provides us not just a deterministic forecast with a single value, but also an interval, offering insight into the model’s confidence in its prediction: the smaller the interval (or spread) the higher the confidence, and vice versa.
For instance, the spread over much of Tanzania is small (around 5 days), especially for the (latest) forecast of September 2023 (Figure 4). Note also that the spread tends to reduce as the forecast range shortens (so for the more recent forecasts), even if that is not always the case as seen in the general increase for the August forecast compared to the July one. However, note that confidence does not imply higher forecast accuracy. The latter needs to be evaluated over many forecast cases, typically covering a few decades.

Figure 4. Spread in the forecast, as measured by the difference between q67 and q33, of the onset date in days for the months: June, July, August and September 2023, corresponding to the forecasts in Figure 3. Country boarders are marked with dotted lines.
The WEMC team working on the FOCUS-Africa project remains committed to providing actionable climate predictions for the SADC region. As the rainy season approaches, we hope this forecast serves as a valuable tool for all stakeholders, and when reaching an operational status, it will be updated regularly, every month, and provided via the Teal tool, thus facilitating decision-making towards a more resilient southeast Africa.
Acknowledgement: This work was funded by the EU H2020 FOCUS-Africa project GA869575 and performed by the World Energy and Meteorological Council (WEMC).


