

Curious to know about historical climate events at COPs locations?
Every year, the international climate-change community gathers at a different location to advance global efforts to curb climate change. This is more than negotiations among diplomats, it is an international, multi-cultural celebration. After a year’s break, this year’s Conference of the Parties (COP) of the United Nations Framework Convention on Climate Change (UNFCCC) is back in Glasgow for a fortnight of climate talks and a long-awaited global get-together.
It is a time for reuniting with long-known colleagues from other parts of the planet, share knowledge and lessons learned, as many of the attendees have attended regularly for years. And maybe some of them will remember what was actually happening with the weather during previous COPs, and how things have changed during the last two decades.
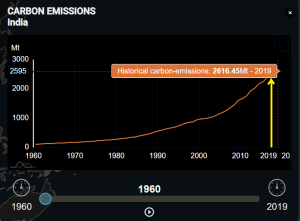
To add to the conversation, the WEMC team is excited to share historical facts of climatic events that occurred during previous COPs by using our tool: Teal. Our method for finding them out is simple, we just looked up the year and country a particular COP was held, opened #TealTool, and started discovering what was happening with the wind, temperatures, precipitation or carbon emissions during that year in that country. We discovered many interesting facts that most of us didn’t know or couldn’t remember, but the data were waiting for us to be used. Our journey will take us to Germany, then India, Mexico, Peru, Morocco, South Africa, Indonesia, Qatar and South Africa, covering a vast expanse of climatic and geographical conditions. If you want to find out what we discovered, follow us on Twitter for daily climatic snippets from the past.
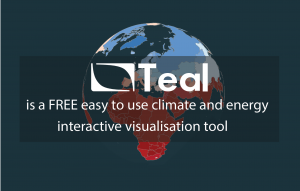
We hope that these bites will whet your appetite for more in-depth explorations into historical climatic events. Indeed, the Teal tool makes complex climate data easy to visualise and access. It was developed by the WEMC multi-disciplinary expert team to provide an accurate and robust climate data resource for anyone interested in exploring global climate data visualisation, at different time resolutions, ranging from annual, seasonal, monthly and even daily. And you can also access information at subnational level. Climate data come from the Copernicus Climate Data Store and the carbon emission data from the Global Carbon Project.
Teal is easy-to-use, freely available and requires no prior experience in understanding climate data. It includes information on:
- Air temperature – to explore highest and lowest temperatures and changes since 1950.
- Precipitation levels – can help identify extreme weather events, such as droughts and floods.
- Carbon emissions – to see how a country’s CO2 emissions have changed from 1960 to 2019.
- Solar radiation and wind speed – which are important for production of renewable energy.
If you are born after 1950, you could check the weather on the day you were born or for a special date in any part of the globe. Historical data is important, as Santanaya clearly stated “Those who cannot remember the past are condemned to repeat it”, and as you would be hearing during COP sessions and others have been saying for years, we are running out of time to keep repeating mistakes. That is why #TealTool is very useful to learn and discover what was happening since the 1950’s, hence around the time CO2 emissions started to have leave its fingerprint on climate change.
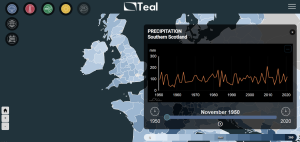
We will start our journey in Glasgow, Southern Scotland, through the November months since 1950. With Teal we discover that the highest average air temperature was 8.8oC in 1994 and the lowest 2.2oC in 1965, both on the chilly side. COP participants, especially frm the Global South, are kindly advised to pack a warm coat, scarf, hat and gloves. If you are wondering whether to bring an umbrella, the wettest November on record (since 1950) was in 2009, with a whooping 213 mm of precipitation. The driest, in 1958, saw only 31 mm, but if you have a look at the graph below you will see that November is usually wet. Chances are that you will experience a few showers and therefore need an umbrella over the 2 weeks of COP. A quick internet search for ‘floods Scotland 2009’, shows that severe floods hit Scotland in the beginning of November 2009. However, in terms of CO2 emissions, the UK including Scotland, have seen emissions steadily decline since 1979.
So, wrap up warm, bring your umbrellas (and complete it with a Scottish Whisky if you like) and join us on Twitter for a climate exploration journey throughout the #UNFCCC #COP countries.
Would you like to learn more about WEMC’s (World Energy & Meteorology Council) work? Why not subscribe to our newsletter?
Curious to know about historical climate facts? Try Teal tool, it is free.


