
After an intense 12 months working on the C3S Climate & Energy Education Demonstrator referred to as ‘Edu Demo’, the WEMC team is proud to have successfully completed it.
The C3S Climate & Energy Education Demonstrator (C3S Edu Demo) is a project is supported by the Copernicus Climate Change Service (C3S), one of the European Union’s Copernicus Earth Observation Programme services and is operated by the European Centre for Medium-Range Weather Forecast (ECMWF) on behalf of the European Commission.
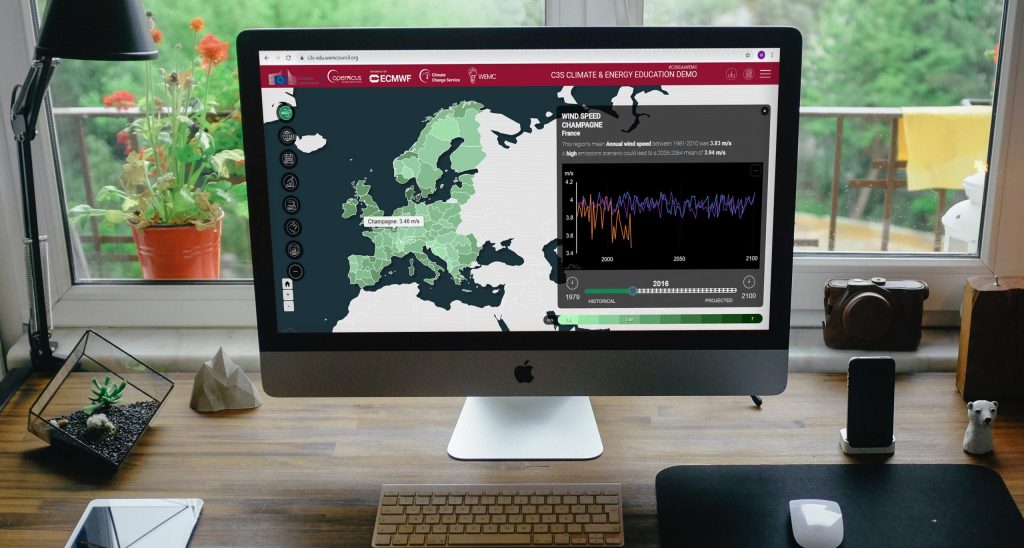
The C3S Edu Demo aims to inform, raise awareness and provide data about climate change and related energy issues. A key objective of the C3S Edu Demo is to enhance user experience, to allow students and teachers to seamlessly navigate through the various options. The C3S Edu Demo is being designed to be integrated with and to complement existing school curricula, including the International Baccalaureate.
NEWS
INTRODUCTION VIDEO FOR THE C3S CLIMATE & ENERGY EDUCATION DEMONSTRATOR
Watch the introduction video to the Climate & Energy Education Demonstrator here>
GET EDUCATED ON CLIMATE CHANGE: A SMART DATA VISUALISATION TOOL FOR SCHOOLS
How the C3S Education Demonstrator works with your school curriculum to introduce younger people to the climate change and energy conversation. Read the article >
C3S EDUCATION DEMO: A FREE GEOGRAPHY TEACHING RESOURCE FOR HOMESCHOOLING
With much of Europe practising social distancing and many schools being closed due to the COVID-19 coronavirus, we thought we’d do our part to help homeschooling parents and carers, and teachers engaged in remote learning keep their students knowledge up-to-date. Read the article >
Scroll down for fact-sheets, educational videos, tutorials and resources made by teachers that you can use with the tool!
Variable Fact Sheets
Click on an icon below to download a factsheet for that variable, containing definitions, fun facts, a glossary and more!
Climate Variables
The following climate variables can be selected via the Edu Demo: air temperature, wind speed (at 10m height), total precipitation and solar radiation. These are chosen both for their importance as climatic indicators, but also because the are the main factors affecting the energy variables displayed with the Edu Demo.
Air temperature is the main indicator of how the climate evolves. It is linked to electricity demand, and can also affect solar power production.

Wind speed provides an indication of the strength of the atmospheric circulation. It is also linked to wind power production.

Precipitation provides an indication of how wet or dry the earth system is. It is also linked to hydroelectric production (the latter is not currently available on the Edu Demo).

Solar radiation is the amount of energy coming from the sun that reaches the ground. It is also linked to solar power production.
Energy Variables
The following energy variables can be selected via the Edu Demo:
Electricity demand, wind power production and solar (photo voltaic) power production.

Electricity demand is what the electricity system needs to produce in order to keep the lights on.

Wind and solar power are fast growing renewable sources of power.

Resources Made by Teachers

DOWNLOAD
Should the UK make investments in solar panels or wind turbines as a method to mitigate against climate change? (Frances Billin, Attleborough Academy Norfolk, UK)
A decision making exercise (DME) activity which also tasks students to explore the background and context for the suitability of and need for renewable energy in the UK. Students use the Edu Demo to answer a series of questions, and ends with a writing task using the PEEL (Point, Evidence, Explain, Link) structure.
Suitable for: Middle & high school students, based on the UK AQA GCSE Geography syllabus Unit 3.1.1.4
DOWNLOAD
Potential changes in climate in Europe and the UK (Denise Freeman, Oaks Park High School, Ilford, UK)
A guided report-writing activity which builds students’ background knowledge to the issue of climate change and helps them to practise describing changes based on data.
Suitable for: High school students, based on the UK Edexcel-A GCSE Geography syllabus topics 2.1-2.4
DOWNLOAD
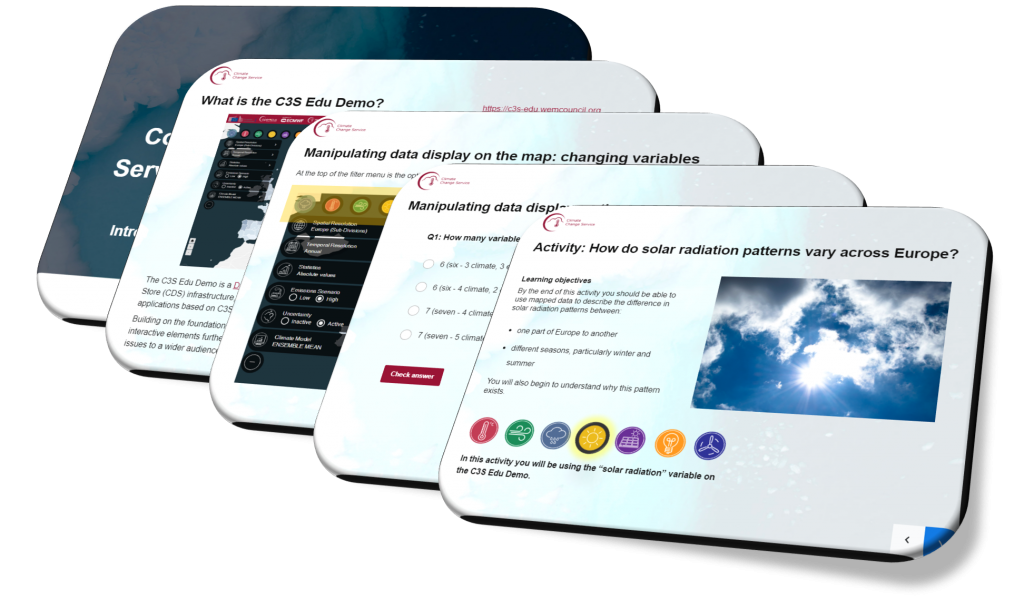
Solar radiation patterns across Europe (Kit Rackley)
A guided activity with a set of questions to help describe and explain the pattern of solar radiation across Europe and between seasons.
Suitable for: Middle & high school students, applicable to a number of Geography, Science and Natural/Earth Science syllabuses.
DOWNLOAD
Climate change adaptations: How does climate change influence European tree species? (Laura Bytheway, University of Birmingham & Ormiston SWB Academy)
A guided activity to explore how the range of a selected number of European tree species may change and adapt due to changes in climate.
Suitable for: Middle & high school students, applicable to a number of Geography, Science and Natural/Earth Science syllabuses.
Educational Videos
Solar Radiation Patterns Across Europe
This video explores the pattern of solar radiation across Europe, how it changes throughout the year, and why these patterns exist.
**This is a proof-of-concept ‘pilot’ video demonstrating educational application and concepts for learning using the C3S Climate & Energy Education Demonstrator tool**
What are the Different Carbon Emission Scenarios?
This video explores how what is meant by different carbon emission scenarios and how you can explore them using the tool.
**This is a proof-of-concept ‘pilot’ video demonstrating educational application and concepts for learning using the C3S Climate & Energy Education Demonstrator tool**
Tutorial Videos
C3S Climate & Energy Education Demonstrator: A Demonstration
A demonstration of the C3S Climate & Energy Education Demonstrator application tool. This video gives you a whistle-stop tour of the tool’s key features, capabilities and functions. It also provides an example of how to use the tool in an educational setting, using a enquiry question.
C3S Climate & Energy Education Demonstrator: Teacher & Student Interview
WEMC’s Education & Program Officer Kit Rackley interviews Frances Billin, Head of Geography at Attleborough Academy Norfolk and two students, who give their thoughts about the C3S Climate & Energy Education Demonstrator, how it can be used for learning, and other related topics.
C3S User Learning Service (ULS) Lessons
C3S Education Demonstrator ULS lessons
- Lesson 1.0: C3S Edu Demo – Introduction & basic functions
- Lesson 1.1: C3S Edu Demo – Using the graph and downloading data
- Lesson 1.2: C3S Edu Demo – Advanced functions
Related C3S ULS lessons & learning paths
- Lesson: Using climate models for climate scenarios
- Lesson: Climate Data Store & Toolbox
- Lesson: Climate Data Discovery – entry level
- Learning Path: 1.0 Background knowledge on climate
Upcoming
Past
Launch webinar: Tuesday 7th January 2020
The launch of the new exciting educational tool to explore climate and energy data. The full agenda and line-up can be found on the event page.
Watch the webinar recording here:
User Consultation Workshop: Monday 27th January 2020
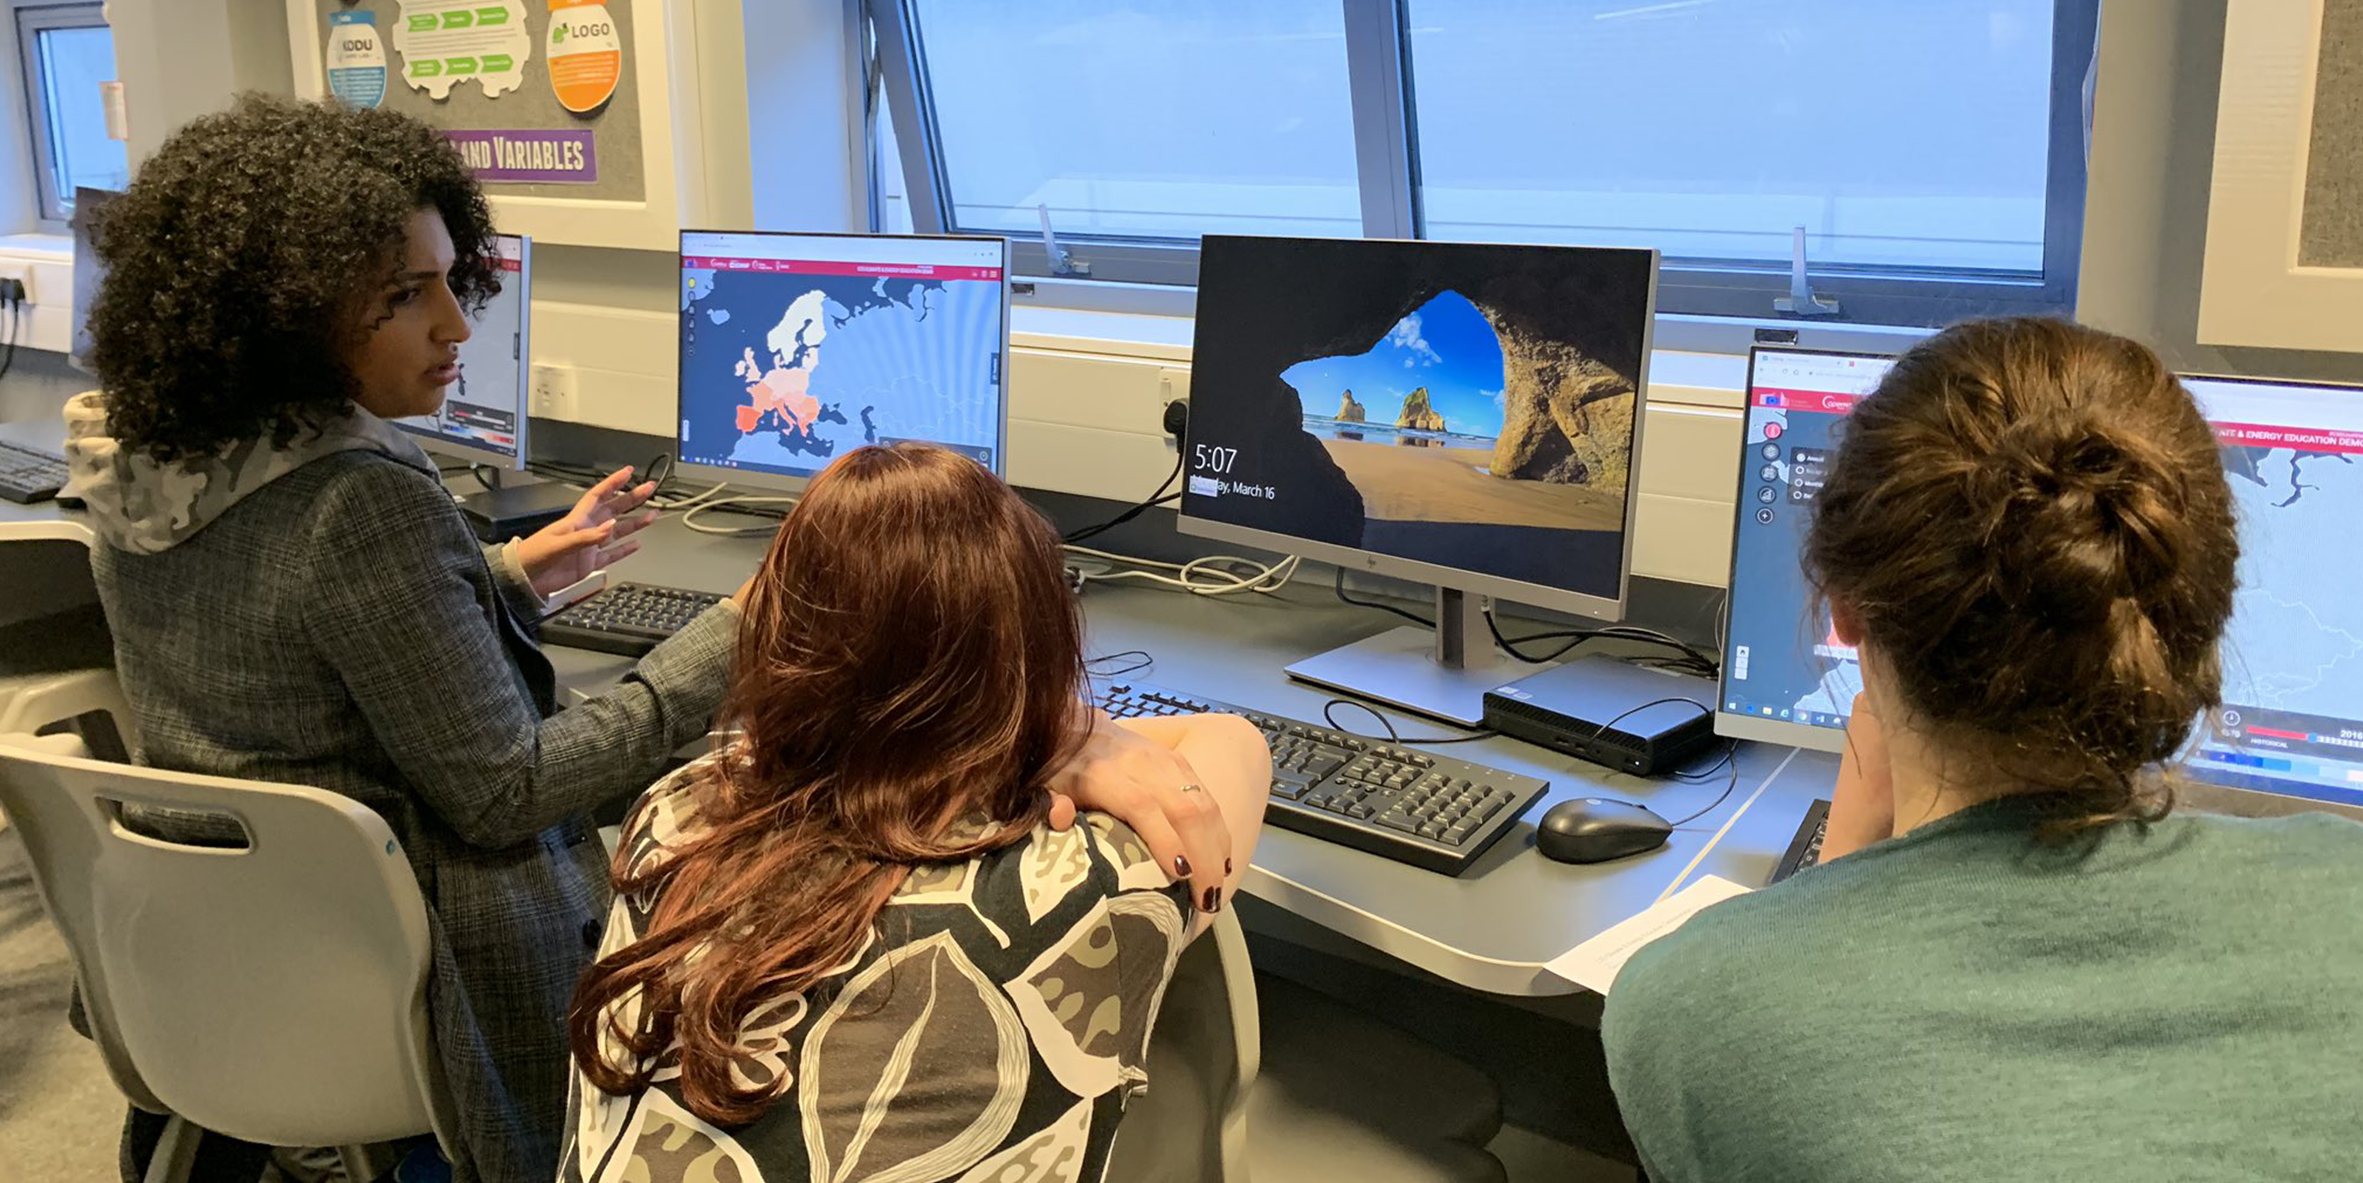
Following on from the launch webinar, this first online user-consultation workshop guided teachers and educators to engage with the tool to experience its educational potential. The workshop featured an interview with a teacher and two of their students, providing their perspective and context to how the C3S Education Demo could be used and applied in the classroom. The workshop involved interactive discussion and tasks which allowed attendees to discover for themselves how the tool could be used in different contexts, and an opportunity to reflect and evaluate helping us to ensure the tool has a sustainable legacy as an educational resource.
Full details and an agenda can be found here.
Watch the workshop recording here:
Online Teacher Workshop: Saturday 21st March 2020
Following on from the first online user-consultation workshop (above), this interactive and collaborative CPD workshop built on the previous workshop and focused on the new and updated features of the C3S Education Demonstrator tool. The free workshop involved interactive discussion and facilitated valuable feedback on the more recent updates. All participants received a certificate to be used as evidence of training/CPD (continuous professional development).
Full details and an agenda can be found here.
Watch the workshop recording here:
Geographical Association eConference 2020: Friday 17th April 2020
A one-hour webinar titled “Climate GIS for the classroom” was presented by WEMC’s Education & Program Officer, Kit Rackley, at the Geographical Association’s eConference for teachers.
Aimed at educators who teach Geography, Science, Mathematics and related subjects to students aged 7-18 years (UK Key Stages 2-5), the webinar began with the important context of learning through GIS about the topic of climate change, and gave examples of ‘off the shelf’ free-to-use GIS tools that can be used in the classroom. Then the focus turned to demonstrating and exploring the C3S Edu Demo.
Download: Presentation PDF
Download: Survey results PDF
Download: Common queries
UKEdChat Online Conference 2020: Wednesday 10th June 2020
A 20 minute webinar titled “Climate GIS for the classroom” was presented by WEMC’s Education & Program Officer, Kit Rackley, at the UKEdChat Online Conference for teachers.
Aimed at educators who teach Geography, Science, Mathematics and related subjects to students aged 7-18 years (UK Key Stages 2-5), the webinar was a repeat (with some adaptations) to the talk given for GAeConf20 (above).
Link: Access a recording of the webinar (navigate to ‘Session 3’ and view the video from ‘Chapter 2’)
Link: Online chat forum for the webinar

100% RENEWABLE (ENERGY SCENARIO) This scenario relies only on Renewable Energy Sources, thus nuclear and fossil energy generation are excluded. High GDP, high electrification and high energy efficiency are assumed. Storage technologies and demand side management are widespread.
ABSOLUTE AIR TEMPERATURE The actual number of a given measurement from zero (0): “The thermometer says the temperature is 14.3°C”
AIR PRESSURE The ‘weight’ of air molecules that press down on the Earth. As air warms it becomes lighter and less dense. This is called ‘low’ pressure and often gives you windy, unsettled weather. ‘High’ pressure tends to give you calm, settled and sunny weather.
ANOMALY The difference between what you would expect based on an average of past readings and what was recorded: “December 2010 in Germany was 5.61°C colder than the average over the 30 years before”
ANNUAL AIR TEMPERATURE The mean air temperature for an entire year (January to December) for a given place: “The annual air temperature for France in 2006 was 12.25°C”
DROUGHT Can be defined as a prolonged period of below average rainfall which usually leads to a shortage of water: “The drought in the south-east of the United Kingdom has forced the government to issue a hose-pipe ban”
ELECTRICITY CONSUMPTION How much electricity has been consumed over a period of time. If you used your 50W laptop for two hours, it will consume 100 watt hours (50×2) of electricity. It is this measure that energy companies use to work out your household energy bill.
ELECTRICITY DEMAND How much electricity is being consumed at a specific time. The electrical items you use at home will have a ‘wattage’ rating, stating how much electricity it will demand. For example, a laptop may demand around 20-65 watts (W), but an oven may demand around 2000W. This is important for energy companies to know so they can plan to ensure everyone receives enough electricity.
ENERGY STORAGE The capture of energy produced at one time for use at a later time, most commonly by use of batteries. Given the variability and seasonality of renewable energy, energy storage is thought to be an important way to maximise the benefits of it e.g. storing solar energy produced during sunny periods and then using it at night time.
FLASH FLOODING When a large amount of precipitation falls during a short space of time leading to a flood which comes very quickly after the storm: “A month’s worth of rain fell in 2 hours causing flash flooding and mudslides.”
FOSSIL, NUCLEAR & CARBON CAPTURE (ENERGY SCENARIO) In this scenario, decarbonisation is achieved mainly through nuclear and carbon capture storage. Renewables play a less significant role and centralised projects are preferred. GDP growth is high. Electrification of transport and heating is significant and energy efficiency is low.
INSTALLED CAPACITY The amount of energy that a power station is able to produce. For example, a solar PV array on the roof of a house might have an installed capacity of 2kW, but may only actually produce this much power in the middle of a bright sunny day.
LARGE-SCALE RENEWABLE & STORAGE (ENERGY SCENARIO) The scenario focuses on the deployment of Large-scale Renewable Energy Sources such as projects in the North Sea and North Africa. GDP growth is high and electrification of transport and heating is very significant. The public attitude is passive resulting in low energy efficiency and limited demand-side management. Thus, the electricity demand is very high.
LATITUDE The measure of how far a place is on Earth, north or south from the equator. The equator is given the number 0 (zero) degrees and the further north or south you go, that number goes up. The north pole is 90 degrees north and the south pole is 90 degrees south.
LONG-TERM MEAN An average that has been taken over a long period of time, usually 30 years or so. For example, Spain’s June solar radiation long-term mean for the years 1981 to 2010 was 305W/m2.
MONTHLY RAINFALL The amount of rainfall recorded in one month. Rainfall can be recorded over any time period, such as a day or a year: “79mm of rain fell in October this year”
PEAK ELECTRICITY DEMAND The period of time where the highest amount of electricity is demanded from the energy grid. In most European countries, for homes, this is in the afternoon when everyone gets home from work and starts cooking dinner and turning on things like the TV!
RENEWABLE ENERGY Often referred to as ‘clean’ or ‘green’ energy, this comes from natural sources or processes that are constantly replenished on a human time-scale. Examples are sunlight, wind, rain (hydro), tides, waves, and geothermal heat.
SEASONAL Something that changes as the seasons (Spring, Summer, Autumn & Winter) change. Solar radiation, and so the heat and light a place gets from the sun, can be much less in the winter than in the summer, for example.
SMALL, LOCAL, SMART & STORAGE (ENERGY SCENARIO) The small & local scenario focuses on local solutions dealing with de-centralised generation. GDP and population growth are low. Electrification of transport and heating is limited but energy efficiency is significant, resulting in a low electricity demand.
STORM SURGE A rise in sea level due to very low air pressure and strong winds. Storm surges can be very destructive to coastlines that are in their path. One of the most devastating storm surges to hit Europe was in 1953, causing damage and loss of life along the North Sea coastlines of the UK, Belgium and Netherlands.
TRANSNATIONAL & MARKET (ENERGY SCENARIO) In this scenario, the electricity sector is assumed to be market-driven. A preference is thus given to centralised projects (renewable and non-renewable) and no source of energy is excluded. Carbon Capture Storage is assumed to be mature. GDP growth is high. Electrification of transport and heating is significant but energy efficiency is limited.
VARIABLE WIND Wind speed and direction can change quickly. There may be a sudden gust, which is a burst of high wind speed, for example. When a low-pressure weather system, called a depression, passes over you, winds may get faster or slower, and can change direction in a matter of hours even minutes.
Downloading map data currently produces a .csv file where the countries and sub-divisions are labelled by a code. Please see below for a reference sheet that allows you to identify the spatial areas.
Why does historical data only go to 2016? Why can I only see data for Europe?
The current dataset used by the tool for historical climate data is based on the C3S European Climatic Energy Mixes (ECEM) project, whose climate variables are all available via “Climate data for the European energy sector from 1979 to 2016 derived from ERA-Interim”. This dataset has been used while efforts to produce new data based on the latest reanalysis, ERA5, which contain more recent observations, have been ongoing. These updated data will be used soon by the tool, so do sign-up for updates and we’ll keep you posted. In the meantime, you can access ERA5 climate data from the Copernicus Climate Change Data Store here.
What are your data sources?
Data for climate variables are sourced from “Climate data for the European energy sector from 1979 to 2016 derived from ERA-Interim”. Most data for the energy variables have been constructed from those. There are two exceptions: historical solar PV and wind energy production for Europe come from Our World in Data and the data used to construct their ‘Primary energy consumption by source’ visualisation (CC BY 4.0).
Why do climate projection data go into the past even though we have observed data for the historical period?
Scientists run climate models starting from the past to try to represent the past climate as closely as possible to recorded climate observations. Climate models used for projections are not meant to represent the characteristics of each year but should be able to represent the average climate, say temperature, over a period of 20-30 years. However, the main use of the past climate simulation is to provide a reference for the future projections, so we can know how these are different from the past/current climate (e.g. warmer or colder). As you can see from our tool, climate models match reasonably well observed temperatures.
How have each of the five future energy scenarios been developed, and what do each mean?
The five energy scenarios are based on ENTSO-E’s eHighway2050 project.
Fossil, nuclear and carbon capture
In this scenario, decarbonisation is achieved mainly through nuclear and carbon capture storage. Renewables play a less significant role and centralised projects are preferred. GDP growth is high. Electrification of transport and heating is significant and energy efficiency is low.
Large-scale renewable & storage
The scenario focuses on the deployment of Large-scale Renewable Energy Sources such as projects in the North Sea and North Africa. GDP growth is high and electrification of transport and heating is very significant. The public attitude is passive resulting in low energy efficiency and limited demand-side management. Thus, the electricity demand is very high.
100% renewable
This scenario relies only on Renewable Energy Sources, thus nuclear and fossil energy generation are excluded. High GDP, high electrification and high energy efficiency are assumed. Storage technologies and demand side management are widespread.
Transnational & market
In this scenario, the electricity sector is assumed to be market-driven. A preference is thus given to centralised projects (renewable and non-renewable) and no source of energy is excluded. Carbon Capture Storage is assumed to be mature. GDP growth is high. Electrification of transport and heating is significant but energy efficiency is limited.
Small, local, smart & storage
The small & local scenario focuses on local solutions dealing with de-centralised generation. GDP and population growth are low. Electrification of transport and heating is limited but energy efficiency is significant, resulting in a low electricity demand.
If you would like to find out more and are interested in the technical background, see this report.
I've been using other visualisation tools to look at changes in climate and noticed that there are slight differences in the figures between them. Why is this?
With a wealth of data available, both for historical records and projections from climate models, there will be some reasonable and slight differences. Historical temperatures, for example, might be slightly different depending on the methodology used to process the data, including quality controlling them, and whether the data have been produced by a ‘reanalysis’ (see here for a good video from Copernicus ECMWF). Looking to the future, there are many climate models run under different scenarios, and therefore with different output. In order to give an idea of the range of output available, our tool combines seven of some of the main climate models into an ‘ensemble’, although you are able to explore each model’s output if you wish.
Is it possible to have some come into our school to run a training session on the tool or show the tool to our students?
This is something we would certainly consider. We invite you to first have a look at the ‘Training’ tab for recordings that you may find helpful, including news of any upcoming events. And if you are still keen for us to visit or set up some remote online-based interaction, we are very happy to discuss this with you. Please contact us via the ‘Contact’ tab.
When I download the data, what do the header codes like "ES", "IE" and "96IT" mean?
These refer to countries and sub-divisions of countries. You can find a reference sheet on the glossary tab.
The sign-up and log-in form has disappeared. Why has it been taken away and what was it used for?
While the C3S Edu Demo was under development as a ‘Demo Case’, we needed to track how often users return but also the type of user using the tool by collecting simple demographic information. Email addresses were used to identify returning users and were not used to for any other purpose unless they checked a box to receive updates about the tool. Now that the Demo Case phase of developing the tool is over, we no longer need to collect demographic data via a sign-up form and it was removed with the update to v1.5.1 on 13th May 2020.
I am having technical issues, or the tool doesn't appear to have the new/updated features listed in the latest version. What can I do?
The tool should work on all major browsers but is optimised for Google Chrome and Firefox. If you find you are having technical difficulties or not seeing updates, try emptying your web browser’s cache and reloading the tool.
Current version: v1.5.1 (13/05/2020)
- Update: Removed sign-up and log-in form (see FAQs for more details)
Known issues
- Globe occasionally centers on Antarctica upon first-load on mobile devices
- Tour appears too large for some mobile devices and leads to over-sizing of interface on mobile devices with smaller screen resolutions
- Graph module stays active but is blank of plot when kept open switching between different datasets
- Anomaly graphs display uncertainty ranges for ‘absolute values’ rather than for anomaly values
Previous versions
v1.5 (05/05/2020)
- New feature: Switches to mobile-compatible configuration and operation upon detection of use on a mobile device
- New feature: Ability for users to rotate the globe added, when displaying in ‘global vision’ mode
- Update: Reduced size of climate and energy data files to increase performance and reduce load times
v1.4.1 (09/04/2020)
- Update: Changes to some ‘sub-division’ labels to better represent the region that they cover
v1.4.0 (07/04/2020)
- New feature: Hovering mouse cursor over each energy scenario model selector in the menu will now show a tool-tip (alt-text) pop up to describe what each scenario means
v1.3.4 (28/02/2020)
- Bug fix: When the slider is situated on a year covered by energy data projections (2017-2065), the button to download energy data loaded onto the map is no longer broken
v1.3.3 (27/02/2020)
- Bug fix: When the slider is situated on a year covered by climate data projections (2017-2100), the button to download climate data loaded onto the map is no longer broken
v1.3.2 (07/02/2020)
- Bug fix: ‘Absolute’ wind speed plots are for 10m in height (not 100m) and so now correctly lay with the range of the legend, and conform to projection data
v1.3.1 (23/01/2020)
- Bug fix: Map legend no longer appears ‘on top’ of sign-up form
v1.3 (22/01/2020)
- New feature: Ability to download data (CSV, XLSX, JSON) and capture an image (JPG, PNG, SVG, PDF) from the current graph on display
- New feature: User (password-free) sign-in form and ability to consent to update mailings
- Bug fix: Slider and map no longer displays two sets of 2017 & 2018 for solar and wind energy
- Bug fix: Units on graph pop-up labels for temperature, wind speed, solar radiation, electricity demand, solar PV and wind energy no longer incorrectly displaying ‘/y’, ‘/seas’, ‘/mth’ or ‘/day’
- Bug fix: Tour now appears again on start-up and when ‘Tour’ is clicked in the hamburger menu
v1.2.1 (15/01/2020)
- Update: Performance improvements
- Bug fix: Downloading data using ‘download button’ at top right no longer produces “web’s server IP address could not be found” error
- Bug fix: Energy model title on filter menu now displays the correct energy scenario model selected
v1.2 (06/01/2020)
- New feature: Ability to select from five different energy projection models for energy variables
- Update: ‘Resources’ menu link
- Bug fix: text description of projected long-term mean for ‘low’ emission scenario now appears
- Bug fix: ‘Projection’ text no longer showing by slider for datasets that only contain historical data
- Bug fix: Precipitation anomaly map now displays data as percentage rather than absolute differences
- Bug fix: Downloading factsheet for ‘Electricity Demand’, ‘Solar PV’ and ‘Wind Energy’ no longer returns a 404 error
v1.1 (11/12/2019)
- New feature: Ability to zoom map using mouse scroll-wheel
- New feature: User able to provide quick feedback via passive button on right-edge of screen
- Update: Map legend now displays data units
- Bug fix: Historical long-term mean plot (dashed orange line) on ‘all seasons’ and ‘all months’ now plotting accurately
- Bug fix: ‘Letterboxing’ of display no longer occurring on Firefox
Please contact us for more information and opportunities surrounding the Demo – or to share your opinions, feature requests and bug reports – by filling in the form below.
Alternatively, you can submit feedback on the Edu Demo. All responses help us improve and develop this exciting new tool.
